Monday, August 28, 2017

The Normal Forms: Second Normal Form

Last time, in The Normal Forms: First Normal Form, I discussed the rules for the basic arrangement of data in a table. If you don't follow those rules, called the First Normal Form (1NF), you don't even have a table. But even if a table is normalized to 1NF, that doesn't mean it's perfect. Figure 1 shows a table normalized to 1NF.

Figure 1: Order Table - 1NF


The problem here is the danger of introducing errors, called data anomalies, into the table. Data anomalies can be introduced by operator error or through programming. Once you have a single data anomaly in your table, all of your data is suspect, so the remaining normal forms work to remove such data anomalies. Figure 2 shows the same table with data anomalies present.

Figure 2: Order Table with Data Anomalies Present


As you can see, Order 112 has two different customer numbers (444 and 445), which is correct? It is impossible to tell. In addition, both product numbers B7G and B7H are identified as a 'saw'. Are these the same product with different product numbers or different products with the same description? Again, I can't know based on the data in the database.

The root cause of these data anomalies is redundant data, that is, data that is repeated in multiple rows. So we need to minimize this redundant data as much as possible.

Now wait a second! Didn't I just say in the last post that I HAD to repeat the values? Yes I did. But that was to comply with 1NF, which is not the end of the story.

Definition

So let's look at the definition of Second Normal Form (2NF). A table is said to be in 2NF if:

  1. It is in 1NF.
  2. Every field is functionally dependant on the entire primary key, that is, it depends on the entire primary key for its value.

Functional Dependency

Before I can continue, I have to talk a bit about functional dependencies, because all of the remaining normal forms rely on this concept. Functional dependency speaks to the relationship that fields in a table have to each other. It is perhaps best explained by example.

Suppose there is an Employee table, and I am an entity in that table. There is a row that represents all the information about Roger Carlson with Social Security Number (SSN) acting as the primary key. Since all the fields in my row are information about me, and I am represented by the SSN, we can say that each field depends on SSN for its value. Another way to say it is that SSN implies the value of each of the other fields in my record.

If a different row is selected, with a different SSN, the values of all the other fields will change to represent that entity.

Implications

Second Normal Form says that all of the fields in a table must depend on the ENTIRE primary key. When there is a single primary key (like SSN), it is pretty simple. Each field must be a fact about the record. But when there is a compound primary key, it's possible that some fields may depend on just part of the primary key.

Going back to our Order Table example, Figure 3 shows these partial dependencies.

Figure 3: 1NF Orders Table showing dependencies


In order to uniquely identify the record, the primary key of this table is a combination of OrderNum and ProductNum (or Item, but a number is a better choice).

2NF says that each field must depend on the ENTIRE primary key. This is true for some fields: Quantity depends on both the OrderNum and ProductNum, so does Item. However, some fields do not.

Order 112 will be for customer 444 regardless of the product selected. The order date does not change when the product number changes either. These fields depend ONLY on the OrderNum field.

Since some fields do not depend on the entire primary key, it is not in Second Normal Form. So what do I do about it?

Implementation

The solution is to remove those records, which do not depend on the entire primary key, to a separate table where they do. In the process, I remove the redundant or repeated data so there is just a single record for each. Figure 4 shows the process of decomposing the table into two tables.


Figure 4: 1NF Orders table Decomposed to 2NF


This corrects the data anomaly with the two different customers for the same order. However, I still have the problem of the product number and the item description. It's still possible for the same product to have different descriptions or different items sharing the same ProductNum, as Figure 5 illustrates.

Figure 5: Remaining data anomalies.


Product A7S is either a wrench or a nail, and a saw is either product number B7G or B7H.

To correct these problems, I need to add yet another normal form: Third Normal Form. I'll talk about that next.

.

Wednesday, August 16, 2017

The Normal Forms: First Normal Form (1NF)

In Normal Forms: Introduction, I introduced the topic of the Normal Forms, the theory behind the arrangement of fields into tables. Since it is usually best to start at the beginning, I'll begin with the First Normal Form.

The First Normal Form, or 1NF, is the very lowest, basic arrangement of fields in a table. If your table is not in 1NF, then it isn't really a table. Sadly, many novice databases are not even in 1NF.

Definition
A table is said to be in First Normal Form if:
1) there is no row or column order
2) each row (record) is unique
3) each row by column value (field) contains exactly one value
4) there are no repeating columns

What does this mean?

First of all, the operation of the table will be unaffected by the order the rows are in or the order the fields are within the row. It means that each record must be complete unto itself without referencing another row positionally, for example, the row above. Likewise the position of the fields is irrelevant.

Since each record is unique, it means there are no duplicate records. This uniqueness is defined by a field or combination of fields whose value will never be duplicated. This is called the primary key. In order to assure uniqueness, no part of a primary key may be NULL.

Because a field must have a single value, it cannot contain a list or compound value. One over looked consequence of this rule is that each field MUST have at least one value. If the value of the field is not known, it is said to be NULL. (There is some debate over whether NULL is actually a value. I maintain it is, but the discussion is largely semantic.)

Lastly, there are no repeating columns. Repeating columns are columns that store essentially the same information. They may be columns like Product1, Product2, Product3; or multiple Yes/No columns that represent the same information like each product having its own column (Saw, Hammer, Nails).

Implications

Let's take a look at how these rules are implemented and what they mean for table design.

Suppose I want a simple Order table with OrderNum, CustomerNum, OrderDate, Quantity, Item, and ProductNum. Although the definition of 1NF is fairly simple, it precludes a wide range of data arrangements. Let's take a look at some of these arrangements.

Figure 1 shows one way such data can be arranged.

Figure 1: Records with Missing Values


To make each record unique, the primary key would have to be OrderNum and Item. However, since no part of the primary key may be Null, this arrangement won't work. All the values of the primary key must be filled in.

But even more than this, the record is not "complete" unto itself. That is, it refers to other records for information. It's not that the values of OrderNum, CustomerNum, or OrderDate are unknown and therefore NULL. I do know the value, but I'm attempting to represent that data positionally. This, of course, violates the first rule (order is irrelevant) and rule 3 (each field must have a value).

This arrangement is common in spreadsheets and reports, but it is not sufficient for storing data.
Figure 2 shows another way the data can be arranged.


Figure 2: Information Stored In Lists


This violates rule 3. Each field must hold one and only one piece of information and not a list. It would be a nightmare to do anything with the date in the Item field other than simply display it because the database management system is designed to treat fields as indivisible.

While Figure 2 is an extreme example that mixes multiple fields in addition to multiple field values, believe it or not, I have also seen database designed like Figure 3:

Figure 3: Data stored in multiple lists


While this is better than Figure 2 (at least it does not mix fields), it is still not atomic and you'd have difficultly associating a quantity with a particular product.

Compound Values:
1NF also precludes compound values, things like full names in a single field or multi-part identification numbers.

Full Names

Why not store a full name? Roger J. Carlson is certainly pertinent information about me. However, it is not indivisible. It is made up of a first name, middle initial, and last name. Because I may want to access just pieces of it (using the first name in the salutation of a letter or sorting by last name), the information should be stored in separate fields.

Multi-part Numbers

Often, a database requirement is to have an identification number that is composed of different, meaningful parts. A serial number may have a four-digit product code, followed by the manufacture date (8 digits), and ended with the facility ID. It might look like this COMP02222008BMH. While this may be a useful arrangement for humans, it is useless in a database. Each value should be stored in a separate field. When the serial number is needed, it can be concatenated easily enough in a query, form, or report.

Figure 4 shows data that is stored in repeated columns.

Figure 4: Data Stored in Repeated Columns


This arrangement is common for people who use spreadsheets a lot. In fact, this is so common it is called "committing spreadsheet". The problem, in addition to having multiple columns, is that in order to associate a quantity with a product, you would have to do it positionally, breaking rule 1.

Lastly, another version of the Repeated Columns error is multiple Yes/No columns. Figure 5 illustrates that.

Figure 5: Data Stored in Yes/No Columns


At first blush, this does not seem to have the same problem, but all I've done is replace generic field names (Product1, Product2, etc) with specific ones (wench, saw, etc). It would be extremely easy to check a second field in any row and they you would have no idea which was correct.

Implementation

As we've seen, First Normal Form precludes a lot of possible data arrangements. So what's left? There's really only one possibility left. Figure 6 shows it.

Figure 6: 1NF Correct with Repeated Rows


Each row has a unique identifier and there are no duplicates. Each field contains a single value. The position of the row and field is irrelevant, and lastly there are no repeating columns.

It's perfect. Right? Well, no. While this table does conform to 1NF, it is still has some problems; problems that 1NF is not equipped to handle. For those, I need to look at the Second Normal Form (2NF), which is what I'll do next time.

.

Tuesday, August 1, 2017

The Normal Forms: Introduction

Normalization is a methodology for minimizing redundancy in a database without losing information. It is the theory behind the arrangement of attributes into relations. The rules which govern these arrangements are called Normal Forms.

In What Is Normalization: Parts I, II, III, IV and V, I discussed the decomposition method of normalization, where you put all your fields into a single table and break the them down into smaller, normalized tables.

In Entity-Relationship Diagramming: Parts I, II, III, and IV, I discussed an alternate method which works from the bottom up. It takes the individual pieces of information (Attributes) and group them into logical groupings (Entities).

However, in neither case did I formally define or explain the Normal Forms. And that's for good reason. I find that only after people get a working understanding of normalization do they really understand the Normal Forms and what they imply. Therefore I usually leave them until last. If you haven't read the above mentioned serie, it would be worth your while to do so.

Normalization was first developed by E. F. Codd, the father of Relational Database theory. He created a series of "Normal Forms", which mathematically defined the rules for normalization. Each normal form is "stronger" than the previous, that is, they build upon the previous normal forms. Second Normal Form (2NF) encompasses all the rules of First Normal Form (1NF) plus adding its own rules. Third Normal Form encompasses all of 1NF and 2NF, and so on.

Figure 1: Each Normal Form Encompasses the Previous


In order, the normal forms are: First Normal Form (1NF), Second Normal Form (2NF), Third Normal Form (3NF), Boyce-Codd Normal Form (BCNF), Fourth Normal Form (BCNF), Fifth Normal Form (5NF), and Domain Key Normal Form (DKNF). BCNF comes between 3NF and 4NF because it was developed later, but because of its "strength" belonged between 3NF and 4NF.

Since each normal form encompasses all previous forms, in theory, the higher the normal form, the "better" the database.

In practice, however, normalizing to the first three normals form will avoid the vast majority of database design problems. So it is generally agreed that to be properly normalized, most databases must be in 3NF.

Beyond 3NF, the normal forms become increasingly specialized. Boyce-Codd Normal form and Fourth Normal Form were created to handle special situations. Fifth Normal Form and Domain-Key Normal Form are largely of theoretical intererst and little used in practical design.

So what I'm going to do for this series is limit myself to the first three normal forms, giving their definitions, implications for data, and how to implement them.

In my next post, I'll start with the First Normal Form.

Friday, June 23, 2017

Entity-Relationship Diagramming: Part IV

In Entity-Relationship Parts I, II, and III, I described a method of normalization that builds up from individual data elements. Following this method results in a database design that is normalized to the Third Normal Form -- without having to know what the Normal Forms are.

(I haven't discussed the Normal Forms. Perhaps I will in a later post.)

In Part III, I left off with the completed Entity-Relationship Diagram shown in Figure 1.

Figure 1: Employee Database E-R Diagram


When I do E-R diagramming, I like to ignore the attributes, concentrating instead on just the entities and their relationships. But at some point, obviously, the attributes have to come back into it. I like to save that to the end.

There are some good E-R diagramming tools available out there, like Visio and ERWin, but for small projects, I usually just implement the tables directly in Access and create the Relationships there. The Access Relationship Window works pretty well as a diagramming tool, and you've got a completed database at the end.

Implementing an E-R Diagram

So far, I've talked about Entities and Attributes. I do that deliberately to keep myself from thinking about implementation issues while I'm designing the data model. But at the implementation phase, entities become tables and attributes become fields.

The first thing I do is add an Autonumber, Primary Key field (Surrogate Key), to each table, naming it after the table with a suffix of "ID". Thus the tblEmployee table will have a field EmployeeID. Then I create a Unique Index on the Natural Key I identified during E-R diagramming process.

At this point, my tables look like Figure 2.

Figure 2: Tables with Surrogate Keys Added


Now it's time to look at my relationships. Relationships are created on fields holding related information, Primary Key to Foreign Key. In a One-to-Many (1:M) relationship, the primary key of the table on the "One" side is added to the table on the "Many" side table and becomes the foreign key.

Since there is a 1:M relationship between tblEmployee and tblEmployeeCertification, I'll put EmployeeID in EmployeeCertification and it will become the foreign key for tblEmployee.

I'll do the same with every relationship. The resultant tables look like Figure 3.

Figure 3: Tables with Foreign Keys Added


Lastly, I need to create the actual relationships. I do this by clicking and dragging the primary key of one table into its corresponding foreign key in the other. For instance, I'll click on EmployeeID in tblEmployee and drag it to EmployeeID in tblJobHistory.

When I do, I will get an "Edit Relationships" dialog box shown in Figure 4.

Figure 4: Edit Relationships Dialog Box


The Referential Integrity box will not be checked by default. However, you MUST check it in order to create a true relationship. Without it, Access will create a line between the tables, but it will NOT be a relationship.

When you click the Referential Integrity box, Access should correctly identify the relationship as a One-to-Many relationship. If it does not, if it says Indeterminate, you've done something wrong.

Clicking OK results in the relationship being created. Figure 5 shows that.

Figure 5: Relationship Between tblEmployee and tblJobHistory.

Now, I'll just do that for the rest of the relationships, and I'm done.

Figure 6: Completed Data Model

The process I've outlined here is really just the bare bones. If you're interested in seeing examples in more detail, you can find some in the Tutorials: Database Design section of my website.


.

Tuesday, June 13, 2017

Entity-Relationship Diagramming: Part III

In this Entity-Relationship series, I'm attempting to present an alternative to standard, decomposition-style normalization.

In Entity-Relationship Diagramming: Part I, I grouped all the objects in my business narrative into either Entities or Attributes. Entities are groups of Attributes and Attribute describe Entities.

In Entity-Relationship Diagramming Part II, I defined the relationships between my entities. Relationships store information about how your Entities interact. Figure 1 shows where I left off.

Figure 1: Relationships Between Entities.


Unfortunately, I'm not done yet, for two reasons: 1) as I said in What is Normalization: Part V, many-to-many relationships cannot be directly implemented in a relational database, and 2) I still have an unassigned attribute. So first I'll rationalize the many-to-many relationship and then take another look.

To rationalize a many-to-many relationship between two tables, you create a third table -- an "intersection" or "linking" table. Then you create one-to-many relationships between the linking table and each of the main tables, with the "many-side" of both relationships on the linking table.

As you can see above, Employee and Certifications have a many-to-many relationship, so I need to create a new entity (Employee/Certifications). Sometimes linking tables have logical names. Other times, they don't. In that case, I simply combine the names of the base tables.

Figure 2 shows how the rationalized relationship is diagramed.

Figure 2: Rationalized Employee-Certification Relationship

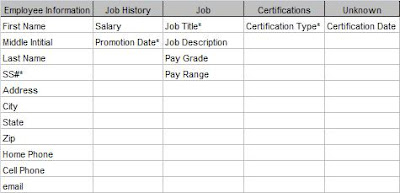
Now I can see where to put my unassigned Certification Date field. The Employee/Certification entity represents a certification for a particular employee and that can be given at only one time. Therefore the Certification Date field goes in this new entity. Figure 3 shows the completed Attribute Grid.

Figure 3: Final Attribute Grid


Now that I've got all the relationships between my entities identified and assigned all the attributes, I can put it all into one diagram.

Figure 4: Final E-R Diagram

Now I've got all the pieces. All that's left is to implement my diagram in Access (or some other database). In Entity-Relationship Diagramming: Part IV, I'll do just that.

.

Tuesday, June 6, 2017

Entity-Relationship Diagramming: Part II

In my last post, Entity-Relationships Part I, I approached the idea of normalization from a different point of view. Rather than breaking a large table into smaller, normalized tables, the Entity-Relationship process starts with the individual pieces and builds it up into a properly designed data model. It uses objects (Entities and their Attributes) and looks at the real-world Relationships that exist between them. The end result of this is an Entity-Relationship Diagram.

I started the process by writing a short narrative of the database requirements and grouping all the nouns into related categories. A few could not be assigned. Figure 1 shows the resultant grid.

Figure 1: Entity-Attribute Grid

At this point, I should say that this is not a strictly linear process . That is, you can't always move smoothly from one step to the next. Sometimes you have to move back and forth between them as you discover more things about your system.

That's what I'm going to do next. Because I have an unassigned attribute, I'm going to look at the relationships between my existing entities and see if something doesn't present itself.

To look at the relationships, I'm going to ignore the attributes for a while. Attributes do not have relationships, only entities do. If you discover that an attribute does have a relationship with some other entity or attribute, that's an indication that it is really an entity and your grid must change.

First, I'll determine the relationships between existing entities. In What Is Normalization, Part IV , I describe the different types of relationships: One-to-One (1:1), One-to-Many (1:M), and Many-to-Many (M:M). Then I'll diagram them in pairs.

The diagramming technique I'll use is one of the simplest. Entities are represented by boxes . Relationships between entities are represented by lines. "Crow's feet" show a "many-side" relationship and a vertical bar shows a "one-side" relationship. Figure 2 shows how the relationship types are represented.

Figure 2: Relationship Types

Many-to-Many: Common in real life, but cannot be represented in a database.
One-to-Many: The most common relationship in a database.

One-to-One: Seldom used.


So how do I know what the relationships are for my Employee Database? For that I need to go back to the narrative. The second paragraph describes "business rules", that is, how the business actually works. I'll repeat the paragraph here.

An employee can have multiple jobs over time, (ie, Analyst, Sr. Analyst, QA Administrator). Employees can also earn certifications necessary for their job.

From this I can write out the relationships in full sentences, and I find it useful to write them in both directions. For instance, from the narrative, I can say:

Employee-JobHistory
Each Employee can have One or More Job History instance
and
Each Job History instance can be for One and Only One Employee.

This is a classic One-to-Many relationship and we will diagram it as follows:

Job-Job History
Each Job can have One or More Job History instance
and
Each Job History instance can be for One and Only One Job.

Another One-to-Many relationship diagrammed as follows: Employee-Certifications
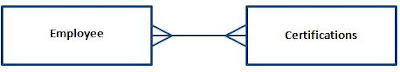
Each Employee can attain One or More Certifications
and
Each Certification can be earned by One or More Employees

This is a Many-to-Many relationship, and this will need additional work, but I'll leave it for now.
Job-Certifications
It might seem that there is no relationship between Job and Certifications, except for the word "necessary" in the narrative. In going back to the client, I discovered that certain certifications are necessary in order to be promoted to some jobs. Thus there IS a relationship as follows:

Each Job requires One or More Certification
but
Each Certification is for One and Only One Job

Another a One-To-Many relationship 
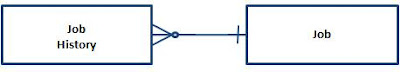
Each certification is only for a single job. It is important to verify this with the client. If a certification were required for many different jobs, the model would be different, but in this case it is for only one job. The certification requirements for Analyst I are different than for Analyst II.

These sentences are extremely useful when communicating with your client (or even if you're developing the database for yourself). If the client can say that each of the sentences is strictly true, then you'll know you've designed it correctly. If any of the sentences are wrong, you have to go back and re-evaluate your design.

Unfortunately, as I said in What Is Normalization, Part V , many-to-many relationships cannot be represented directly in a relational database. So I'm going to have to add some intersection (or "linking") tables.

I'll take care of that next in Entity-Relationship Diagramming: Part III

.

Wednesday, May 31, 2017

Entity-Relationship Diagramming: Part I

In the last series, Normalization Parts I, II, III, IV, and V, I approached normalization from a particular point of view. I put all the information into a single table then removed redundancies into separate tables. This method is called decomposition. Decomposition is fine for understanding the theory of normalization and for creating small databases. However, it is less useful for large databases. At least, I've found it so.

So I'm going to talk about another way to approach normalization that starts with the individual pieces and builds it up into properly normalized tables. This method is called the Entity-Relationship method and the final result is an Entity-Relationship Diagram. An E-R diagram is useful not just for creating the data model, but for documenting it as well.

Since we've been working with the Employee Database in our other examples, let's stick with it. But since I claimed that E-R method works for more complicated designs, let's make it a little more complex. I like to start with a short narrative of the requirements.

Narrative

ZYX Laboratories requires an employee tracking database. They want to track information about employees, the employee's job history, and their certifications. Employee information includes first name, middle initial, last name, social security number, address, city, state, zip, home phone, cell phone, email address. Job history would include job title, job description, pay grade, pay range, salary, and date of promotion. For certifications, they want certification type and date achieved.

An employee can have multiple jobs over time, (ie, Analyst, Sr. Analyst, QA Administrator). Employees can also earn certifications necessary for their job.

Next, I take the narrative and underline all of the nouns. (I'm going to bold them here because Blogger doesn't have underlining.)

Narrative 2

ZYX Laboratories requires an employee tracking database. They want to track information about employees, the employee's job history, and their certifications. Employee information includes first name, middle initial, last name, social security number, address, city, state, zip, home phone, cell phone, email address. Job history would include job title, job
description
, pay grade, pay range, salary, and date of promotion.
For certifications, they want certification type and date achieved.

An employee can have multiple jobs over time, (ie, Analyst, Sr. Analyst, QA Administrator). Employees can also earn certifications necessary for their job.

All of these nouns must be represented in the database -- some as Entities and some as Attributes. An Entity is a "thing" about which we store information. An Attribute is the information that is being stored.

So the next task is to group the nouns into logical groupings. At first pass, it appears that there are three entities: Employee Information, Job History, and Certification. It is useful at this point to put them in a grid and assign the rest of the attributes like Figure 1.

Figure 1: Attribute Grid

Next, I need to assign primary keys to each entity. (At this point, I call them "entities" rather than "tables".) As I said in What Is A Primary Key?, a primary key is a field or fields which uniquely identify a record. At this point, I'm dealing only with natural keys. Figure 2 shows the primary keys.


Figure 2: Attribute Grid with Primary Keys

Now we go back to our entities and look for two things:

  1. see if each attribute can have only one value for that entity, and
  2. see if each attribute truly belongs to the entity.

To determine the second, we look at "functional dependencies", which just means that each field's value depends on the value of the primary key.

So, for the Employee table, a person (as represented by the SS#) can have only one first name, last name, address, home phone, and so forth. That satisfies requirement #1. Secondly, if the value of the SS# changes, then so will all of those values. By that, I mean if we move to a different entity with a different SS#, that entity will have a different first name, last name, etc. (For our purposes here, we will assume that no two employees share any of these attributes.)

Now, what about the Job History table? Any time an entity has a compound primary key, you should look at it very closely to make sure all the fields depend on the entire primary key. Any particular job can have only one description, pay grade, and pay range. However, none of those depend on the Promotion Date.

I've got a problem here and I need to take another look. What I really have is information about two different "things".

Job Title, Description, Pay Range and Pay Grade pertain to the Job as a category. Everyone who holds that position will have the same values. On the other hand, Salary and Promotion Date will be different for each person. So I really have two entities: 1) Job (information about the job itself), and 2) Job History (information about a particular employee's employment history.

I need take Job Title, Description, Pay Range and Pay Grade out of the Job History table and put them in the Job table.

Lastly, in the Certification table, Certification Date is also not fully dependant on the Certification Type. Different individuals achieve the certification at different dates. I don't have an entity to put the date in, so I'll put that to the side and come back to it later.

Figure 3 shows the amended grid.


Figure 3: Amended Attribute Grid

At this point, it is useful to look at the Relationships between these Entities. We may be able to find a place to put our unassigned attribute. But I'll save that for the next post: Entity-Relationship Diagramming: Part II.

.